Towards the Jupiter alignment
Will the four-planet alignment on July 21 coincide with gains?

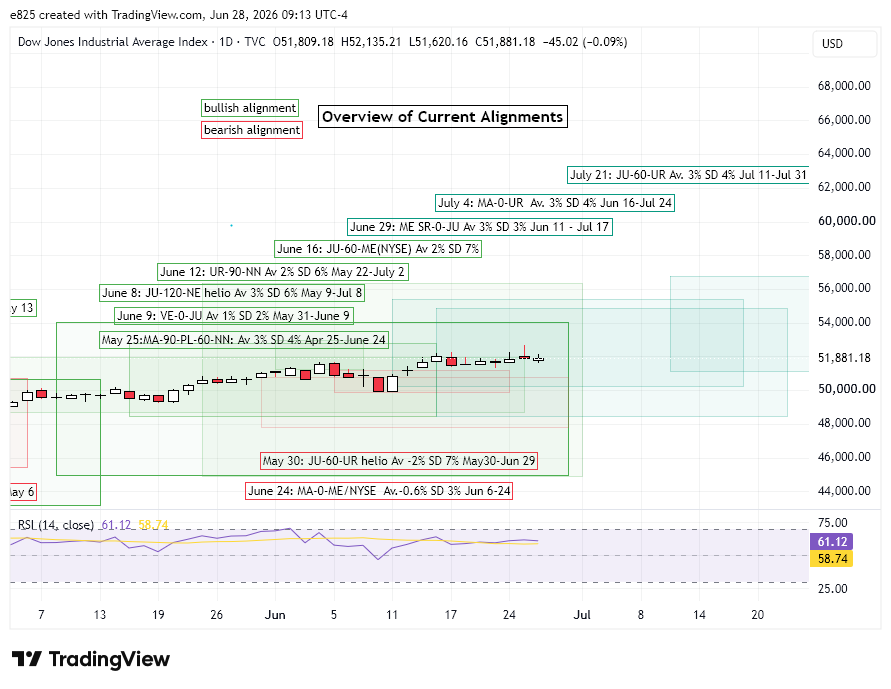
Stocks were generally lower last week as investors took profits in overheated technology and AI-related sectors. While the NASDAQ and S&P 500 were negative on the week, the rest of the market was actually higher as the Dow (DJIA), small cap Russell 2000 and NYSE Composite finished higher on prospects of lower oil prices and moderating inflation.
The tech pullback coincided with a period of relative weakness given the conjunction of Mars to Mercury in the NYSE chart. Based on our backtest of previous conjunctions, stocks tended to be modestly negative in the 12 or 18 days leading up to the June 24 conjunction. The updated cumulative chart below illustrates this period of relative weakness, even if the price changes for the current conjunction (red line) has actually been quite bullish. One reason for this discrepancy is that we used the DJIA for the backtest. Since the Dow has relatively little tech exposure in its 30 constituent companies, it has not been subject to the current 'June swoon'. In fact, it actually made a new all-time high last week.
Other current alignments remain mostly bullish. The 90-degree square alignment of Uranus and the North Lunar Node on June 12 continues to track higher, although here also we used the more bullish DJIA for price data. The updated cumulative trend chart below shows the current up trend exceeds the mean and median lines of previous alignments. Nonetheless, the recent gains of this post-alignment period is largely in keeping with the bullish bias of this pairing.
The upcoming conjunction of Mars and Uranus on July 4 has so far underperformed its historical backtest. An analysis of its previous conjunctions showed a clear bullish bias through the pre- and post-alignment periods. Its relative weakness may be attributed to its random backtest starting point in the middle of the current consolidation/pullback 18 days before the July 4 conjunction. A longer look back period might well have generated a line that tracked the mean and median lines more closely.
The upcoming Mercury retrograde station on Monday, June 29 is another bullish factor that could support stocks in the coming week. As we noted in our backtest study, the fact that Mercury is turning retrograde while in a 3.5 degree conjunction with Jupiter is actually bullish. The updated cumulative trend chart below shows how the current trajectory of the DJIA is following the historical norms for this unique alignment. Far from being bearish as is commonly assumed, the data indicates that retrograde Mercury tends to be bullish when it is conjunct Jupiter both before and after the retrograde station.
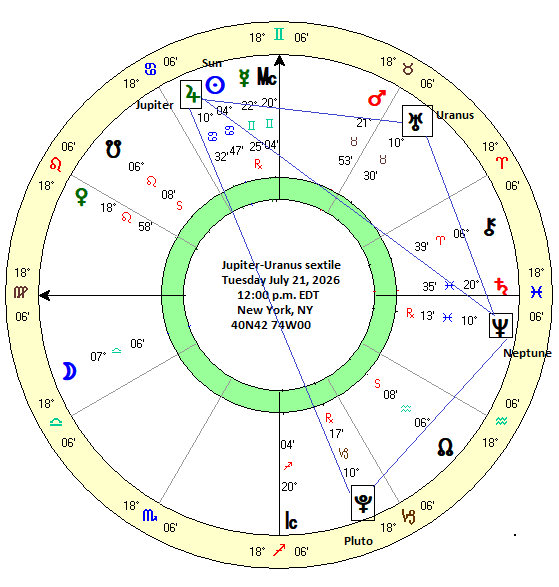
July 21: the Jupiter-Uranus-Neptune-Pluto alignment
Looking ahead to the month of July, we can see a rare Jupiter alignment with Uranus, Neptune and Pluto that would seemingly promise some upside. This four-planet alignment is closest on July 21, although the conjunction of the Sun and Jupiter on July 29 could also represent a significant culmination date for this configuration.
On paper, this alignment looks very bullish. As a general rule of thumb, Jupiter alignments with the outer planets tend to be positive for markets, especially if Jupiter is near its retrograde period. That isn't the case here as Jupiter is moving at its full forward velocity. Nonetheless, by standard deductive logic, there is some reason to think that stocks will be bullish in July. But how can we confirm that empirically?
It's not an easy question to answer since this four-planet alignment has never occurred in the 130-year price history of the Dow Jones Industrial Average. In the absence of previous testable cases, we have to accept data which only bears a partial resemblance to the current situation.
Two previous similar alignments occurred in November 1911 and July 1966. In mid-November 1911, Jupiter formed a 120-degree trine aspect with Neptune -- as it does in late July 2026 -- and a 60-degree sextile aspect with Uranus -- again just as it does in late July. Jupiter did not align with Pluto until early December, however, and even then it formed a 150-degree quincunx rather than a 180-degree opposition as it does in late July 2026. Therefore, this is a very similar alignment although not quite exactly the same. So what did the market do?
After bottoming on September 25, 1911, the Dow rallied 13% through October and November during the formation of this analogous Jupiter-Uranus-Neptune alignment. After making its closest alignment in mid to late November, stocks went sideways from December to February 1912 before resuming their rally in March.
The July 1966 case is somewhat different. In late July 1966, Jupiter formed a 60-degree sextile with Uranus -- as it does in late July 2026. But because Uranus was conjunct Pluto in July 1966, Jupiter also formed a sextile with Pluto. This is a bit different from its 180-degree opposition alignment with Pluto in July 2026. Like July 2026, Jupiter formed a 120-degree trine alignment with Neptune in July 1966.
Unlike 1911, however, stocks in July 1966 mostly declined before and after this alignment. Does this invalidate our bullish thesis of this alignment? I would say no, mostly because of the presence of significant other factors at the time. Actually, 1966 was a terrible year for the stock market as prices peaked in February and then declined 25% by the time of its October low. One major astrological reason for the decline was the presence of an obviously bearish Saturn opposition to the aforementioned Uranus-Pluto conjunction. Saturn exactly opposed Uranus-Pluto in February 1966 and again in November 1966. The nine-month period between its two exact oppositions formed the start and stop dates of the bear market.
Therefore, even though stocks fell through the Jupiter-Uranus-Neptune-Pluto alignment in 1966, this does not invalidate the bullish thesis due to the simultaneous Saturn alignment. There is no such hard Saturn alignment (square or opposition) with any outer planet in 2026 and thus we should not assume that stocks will fall in July. In the absence of any strong Saturn alignment, the Jupiter alignment in July 2026 is more likely to follow the bullish November 1911 pattern.
The Jupiter-Uranus sextile
Another way to approach this four-planet Jupiter alignment is to break it down into its parts. One such part is the 60-degree alignment or "sextile" between Jupiter and Uranus. Since this is a more common alignment, it is possible to create a larger sample of previous cases in order to conduct an aggregated data analysis.
The table below lists the DJIA closing prices across various intervals for the sample of 30 cases from 1897 to 2026. Due to the relatively slower velocity of Jupiter and Uranus, a longer 5-day interval was used starting with 30-days before the exact 60-degree alignment ("-30d"). Prices on the day of the exact alignment were labeled "0d" while prices 30 days after the alignment are found in the column marked "30d". Both the 60-degree and 300-degree sextiles were included in this sample. By counterclockwise reckoning, a 60-degree sextile is formed when Jupiter has moved 60 degrees from its conjunction with Uranus. A 300-degree sextile is still characterized by its 60-degree angular separation between the two planets, but it occurs when Jupiter is approaching the end of its 13-year synodic cycle with Uranus.
The summary statistics table below analyzes the price changes across various intervals. The first column shows the mean price change of 1.06% in the longest 60-day window ("-30d 30d"). The median price change was somewhat higher at 1.40% but this was only slightly more than the benchmark price change of 0.89% based on a 5.4% average annual gain during the backtest period of 1897 to 2022. Although the net lean was somewhat bullish, this result was not statistically significant (p = 0.899) with 62% of cases being positive. Most of the tested intervals were either neutral or slightly bullish and none reached statistical significance ( p < 0.05). The only discernible pattern was that the post-alignment period was slightly more bullish than the pre-alignment period. This is evident in most intervals although none of the post-alignment intervals reached significance. The cumulative trend chart below reflects these unimpressive results.
These mostly neutral results were also seen in the Effect Index, a new measurement I hope to develop further in the future. This combines several of the results of this summary statistics table to create a more accurate picture of the effects of each alignment. Its formula is: (mean + median)/2 * % of positive cases * (1 - p-value). Rather than estimating effects based on mean or median alone, this index incorporates the standard deviation of each sample through the p-value as well as the broader measure of the percentage of positive cases.
Jupiter-Uranus sextile -- 60 degrees only
Although the results of the sample of Jupiter-Uranus sextiles are underwhelming, this is not the case if we disaggregate the sample into 60 and 300 sextiles. The upcoming Jupiter-Uranus sextile on July 21 will be a 60-degree counterclockwise alignment and thus backtesting that specific case is more directly relevant to the current market situation.
The summary statistics table below shows the results across various intervals for this alignment. While the resulting sample is just 13 cases, the results are more impressive. The first column ("-30d 30d") posted a 3.69% mean gain and a 4.67 median gain for the 60-day window. This compares favorably with the 0.89% benchmark. While the result did not reach the significance threshold of 0.05, it came close with p = 0.103. 77% of cases were positive and the Effect Index was 2.89%. In all, 6 of the 15 the tested intervals did reach significance and most were at least moderately bullish.
Clearly, the 60-degree Jupiter-Uranus sextile has a bullish bias which is evident in the cumulative trend chart below. While the period before the sextile alignment is somewhat choppy, the post-alignment period actually looks more positive. This would suggest that stocks could be bullish well after the July 21 exact alignment date.
Implications for this week
The bullish effect of the approaching Jupiter-Uranus alignment is another reason why stocks are more likely to rise this week. Although its effect may not manifest just yet with more than three weeks to go before the July 21 alignment, the overall picture seems more bullish than bearish. And with Mercury turning retrograde on Monday while in conjunction with Jupiter, there is even more reason to expect the current consolidation phase of the market to end soon. Whether or not the tech sector can resume its rally is another question, however, as our backtesting model may better apply to the Dow and the broader market. But since the current Jupiter-centered alignment looks more like the 1911 case than the 1966 case, (i.e. no hard Saturn aspects) a broadly bullish outcome seems more likely.
Disclaimer: Not intended as investment advice. For educational purposes only.
Phenomenal. This is how I approach it too. I think the next month or so is bullish for overall markets. The only thing I can counteract with, is that Saturn is now at a roughly 45 degree to the north node. It hovers there for a while. All the way until November. Once this bullish phase over the next month concludes, mid August through October could get ugly. It’s either we top around early August, and crash until late October, or markets stay afloat from Aug-Oct, and we peak around mid term elections and crash through Q1 2027. I think it’s one of these scenarios. The 60 year Gann cycle is in play, and the 18.6 year McWhirter cycle is also in play. From top in 2008.
This is great thank you