Solar eclipse specifics
A look ahead at the August 12 total solar eclipse

US stocks were mostly lower last week as the semi-conductor sell-off intensified on worries about AI-spending and profitability. While the NASDAQ fell by 4% on the week, the rest of the market experienced only a modest decline. Despite the 6-week pullback in high-flying technology shares, the NYSE Composite is still less than 1% from its July 6 all-time high.
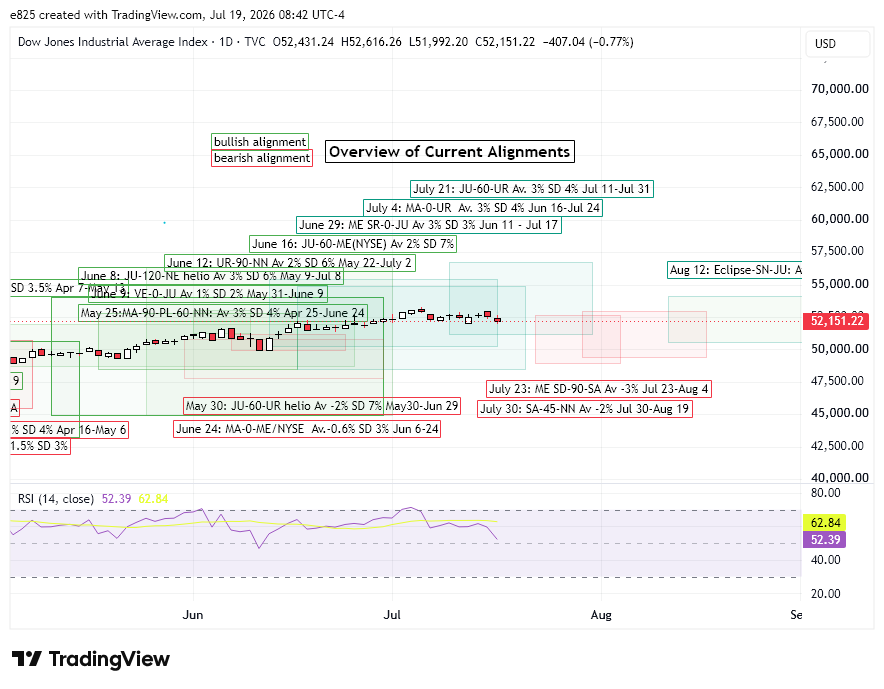
The decline was a bit unexpected given the apparent bullish signature of the rare Jupiter-centered alignment, in addition to other ongoing influences. The so-called Barbault basket in which Jupiter aligns with Uranus, Neptune and Pluto on July 21 echoed similar alignments in 1911 and 1966. This very limited data (n=2) hinted at a bullish market bias from this alignment, although such a small dataset precluded any normal statistical assessment of probabilities.
One of the components of this multi-planet Jupiter alignment was the 60-degree Jupiter-Uranus sextile. Our backtest of 13 previous cases suggested that it was bullish during its 60-day test period. The updated cumulative trend chart actually shows the current alignment is tracking fairly well to the mean and median. Despite recent weakness, it is still above the mean and median and well above the benchmark average. Its 30-day post-alignment period (after July 21) shows a clearly bullish lean and provides some evidence for gains in August.
Other alignments also had a bullish bias. The aftermath of the July 4 Mars-Uranus conjunction suggested a mostly positive effect. The updated cumulative trend chart below shows that the current conjunction is still largely tracking the historical averages fairly closely. It is still above the long-term benchmark and is only slightly under-performing the mean and median of our sample from 1951-2024. We should also note that the backtest study was conducted on the Dow Jones Industrial Average (DJIA) which has fared better than the NASDAQ or the S&P 500 in recent weeks. This may be one reason why results for the current Mars-Uranus conjunction are within target range of the historical norms.
The conjunction of Mercury retrograde and Jupiter has also largely followed historical trends. The June 29 Mercury retrograde station conjunct Jupiter was a bullish influence although stocks peaked shortly thereafter. And yet the updated cumulative chart below shows that its 18-day post-alignment price ended up being very close to the mean and median compared with the starting point of the look back period on June 11, 18 days before the retrograde station. Again, this back test reflected the better recent performance of the Dow relative to tech-laden indexes like the NASDAQ or SPX.
Other alignments look more bearish, however. The 45-degree semisquare of Saturn and the North Lunar Node ("Rahu") has some negative potential, especially after its exact alignment which occurs on July 30. The updated cumulative chart shows the current alignment in historical context. While the chart is choppy it leans slightly bullish in the period before the exact semisquare. Afterwards, prices tend to move modestly lower.for a 20-25 day period. This would equate to about August 19 for the current Saturn-North Node alignment.
We can narrow the dataset sample further by including only Saturn-NN semisquares in which Saturn is retrograde, as this will be the case after Saturn turns retrograde on July 26. And we would think that the close proximity of the retrograde station to this exact alignment makes this sub-sample especially pertinent. While this yielded a tiny sample of 4 cases, it nonetheless closely matches the current circumstance. The updated chart below suggests the bullish pre-alignment may well end 10 days before the alignment on July 20, after which stocks are more likely to trend lower for 20 days (i.e. Aug 19).
Finally, the double station near-square of Mercury and Saturn carries some downside risk. While normal square alignments of Mercury and Saturn are only minimally bearish, their negative correlation is increased if either planet is near a direct or retrograde station. As it happens, both planets are due to station in the coming days as Mercury stations direct on July 23 and Saturn stations retrograde on July 26. Our backtest shows negative market performance for similar alignments of stationary Mercury and Saturn in which the planets formed a "near-square", i.e. they came to within 5 degrees of a 90-degree angle but then reversed their direction.
The updated cumulative chart shows the current pattern is trending below previous alignments. While some pre-alignment upside is still possible before the July 23 Mercury direct station, the negative pull of this alignment will last until mid-August. Of course, a sample consisting of just 3 cases is not a reasonable basis for forecasting. But the clearly negative performance of this very specific planetary set up is still something to consider.
Overall, the current set of alignments create a mixed picture. While the Jupiter-Uranus sextile carries a bullish influence into August, this week's two Saturn alignments would seem to make a more compelling bearish case for the near term. To some extent, these opposing influences could cancel each other out. In my experience, however, the presence of clearly bearish Saturn alignments tend to be stronger than most bullish Jupiter configurations.
Solar Eclipse: August 12
If markets are more vulnerable to declines in the near term, we should try to assess the impact of any relevant planetary patterns in August. One such alignment is the total solar eclipse on August 12, 2026. This will be the first eclipse in the eclipse season which will be followed by a partial lunar eclipse on August 28. Traditionally, eclipses have negative reputation in astrology as they are often seen as portentous omens and harbingers of strife and suffering. Some of this negativity carries over into financial astrology, although eclipses are more often seen as interrupting the status quo and marking trend changes. I don't have a strong opinion of eclipses either way as their ultimate impact is usually open to interpretation.
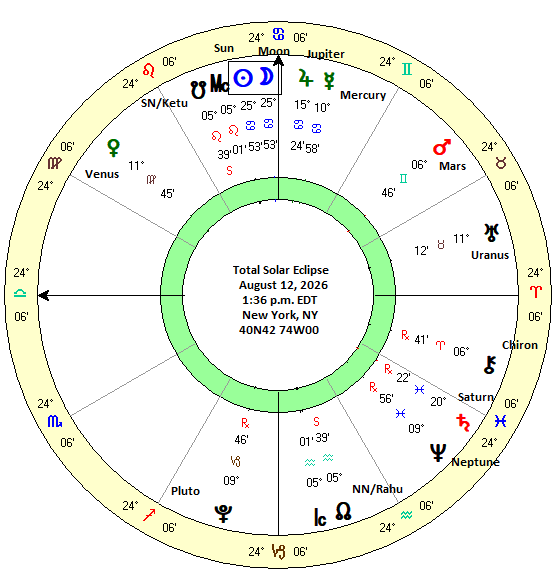
There is no single, agreed-upon way to interpret eclipse effects. Some regard the eclipse date itself as the most salient time marker in terms of measuring market impact while others see eclipses as triggering set ups in which the eclipse point must then be activated by a transiting planet at some later date. According to this trigger theory, the energy of the solar eclipse at 25Cancer/20Leo would only be released at the time of the Mercury conjunction to that point on August 20, or perhaps by the transit of Jupiter to the eclipse point on October 3, or the transit of Mars on November 3, or indeed the conjunction of the South Node on March 20, 2027. The sheer number of possible dates makes the trigger theory more challenging to test.
Given the testing complexities of the trigger theory, let's focus our attention on the simpler as-is approach: what are the likely immediate market effects of this eclipse? Last year, I attempted a straightforward test of eclipses by dividing them into types (solar, lunar, total, partial, etc.) and correlating them with stock market prices. Based on a sample of the 54 most recent eclipses from 2000-2025, I didn't find any obvious price patterns. Perhaps lunar eclipses were slightly more bearish than solar eclipses but no interval or eclipse was statistically significant. On the whole, eclipses had no market effect during either their pre- or post-eclipse periods While this didn't negate the potential significance of eclipses, it meant that whatever effects they might have cannot be measured using a standard aggregate backtest approach. It is still possible that their effects may therefore become measurable only under certain conditions.
This time around I wanted to more closely replicate the conditions of Aug 12 solar eclipse. If we are going to quantify the price probabilities surrounding this eclipse, we need to collect a sample of previous eclipses which most closely match those of the Aug 12 eclipse. We can see that this eclipse will be conjunct the South Lunar Node (aka "Ketu") within 10 degrees and also conjunct Jupiter within 10 degrees of angular separation. In order to get a better understanding of the probable effects of this eclipse, I created a sample of similar solar eclipses which were conjunct the South Node and Jupiter. I included all solar eclipses which had a maximum angular separation, or "orb", of 18 degrees for the South Node and Jupiter. For solar eclipses, 18 degrees is the maximum angular separation between the lunar nodes and the Sun/Moon conjunction.
The table below shows the closing prices for the DJIA before and after these 20 solar eclipses. The negative numbered orbs denote when the Sun-Moon conjunction is applying toward the South Node and Jupiter. Positive numbered orbs indicate the eclipse point (the Sun/Moon conjunction) occurs while separating from the South Node and Jupiter. The upcoming Aug 12 eclipse has a South Node orb of "-10", meaning the Sun-Moon are applying to their eventual Aug 22 conjunction while the Jupiter orb of "10" indicates that the Sun-Moon conjunction is 10 degrees past its conjunction with Jupiter. Prices were recorded starting at 18 days before the eclipse ("-18d") and then at 3-day intervals including the day of the eclipse ("0d E1"). Since the second eclipse in the eclipse season occurs about 15-17 days after the first eclipse, this was labeled as "15d E2".
The summary statistics table below analyzes the price changes at various intervals before and after the eclipse. Most intervals yielded bullish results although none was statistically significant. The first column "-18d 30d" represented the longest interval of 48 days and posted a mean price increase of 2.30% and a median gain of 1.62%. These results were greater than the benchmark of 0.76% based on an average annual return to 5.8% from 1898 to 2019. 70% of cases were positive which is only modestly higher than chance would predict for any random 48-day period. The only bearish interval was the three days immediately before the solar eclipse ("-3d 0d") which had a mean decline of -0.47%, although this was not statistically significant.
These mostly bullish results are illustrated in the cumulative trend chart below. Both the mean and median lines are above the benchmark, although the median has a brief dip below in the period between eclipses, bottoming out at the "12d" mark, 12 days after the solar eclipse. The period after the second eclipse from 15d to 30d is generally bullish.
Conclusion
This study suggests that the upcoming solar eclipse on Aug 12 could have a modest bullish influence. This is possibly the result of the wide Jupiter conjunction to the eclipse point, although the effect is small enough that simple random chance may have also played a role. In any event, this eclipse is unlikely to significantly move markets either way. It is possible that its effects may be delayed according to the trigger theory, as transiting planets may conjoin the eclipse point after Aug 12. But with benefics Mercury and Jupiter due to transit over the eclipse point at 25 Cancer/20 Leo, that would tend to reinforce the potentially bullish influence of the eclipse. But until we actually empirically test the trigger theory at some future date, the eclipse trigger theory remains speculative.
Implications for this week
We are still too far from the eclipse to anticipate any specific effects this week. But with the Mercury direct station due on Thursday, July 23 and the Saturn station on Sunday, July 26, some volatility would not be unexpected. At that time, Mercury will form a near-square alignment with Saturn which may increase downside risk. The presence of Mars in a 30-degree alignment with Mercury only adds to the elevated risk scenario. Despite the imminent arrival of these Mercury and Saturn stations, one would think that the completion of the Jupiter-Uranus-Neptune-Pluto alignment might deliver at least some positive days this week. We shall see.
Disclaimer: Not intended as investment advice. For educational purposes only.